Your Money Should Grow — Even When the Market Doesn't
Destination Trax™ is a proprietary growth strategy with over 20 years of real-world application. It combines principal protection with market-level returns — without exposing your wealth to market crashes.
How Destination Trax™ Works
Deposit Into a Fixed Indexed Annuity
Your money goes into a top-tier FIA with principal protection and a day-one bonus.
Take Penalty-Free Annual Withdrawals
Each year, 10% moves into a market growth account for compounding.
Grow, Protect, Repeat
Your FIA earns. Your market account compounds. The cycle builds on itself.
The Wealth Dilemma Nobody Talks About
You need your money to grow — but you cannot afford to lose it.
CDs & Savings Earn Nothing
Rates barely keep pace with inflation. “Safe” money is losing purchasing power every year.
The Market Giveth & Taketh
S&P 500 dropped 38% in 2008, 34% peak-to-trough in 2020. One crash can set you back a decade.
Traditional Annuities Lock You In
SPIAs surrender your control. Your money is gone, income has an end date.
Backtested Through the Worst Markets in Modern History
$100K deposit tested against 17 years of actual S&P 500 data — including the dot-com crash, 9/11, and the 2008 financial crisis.
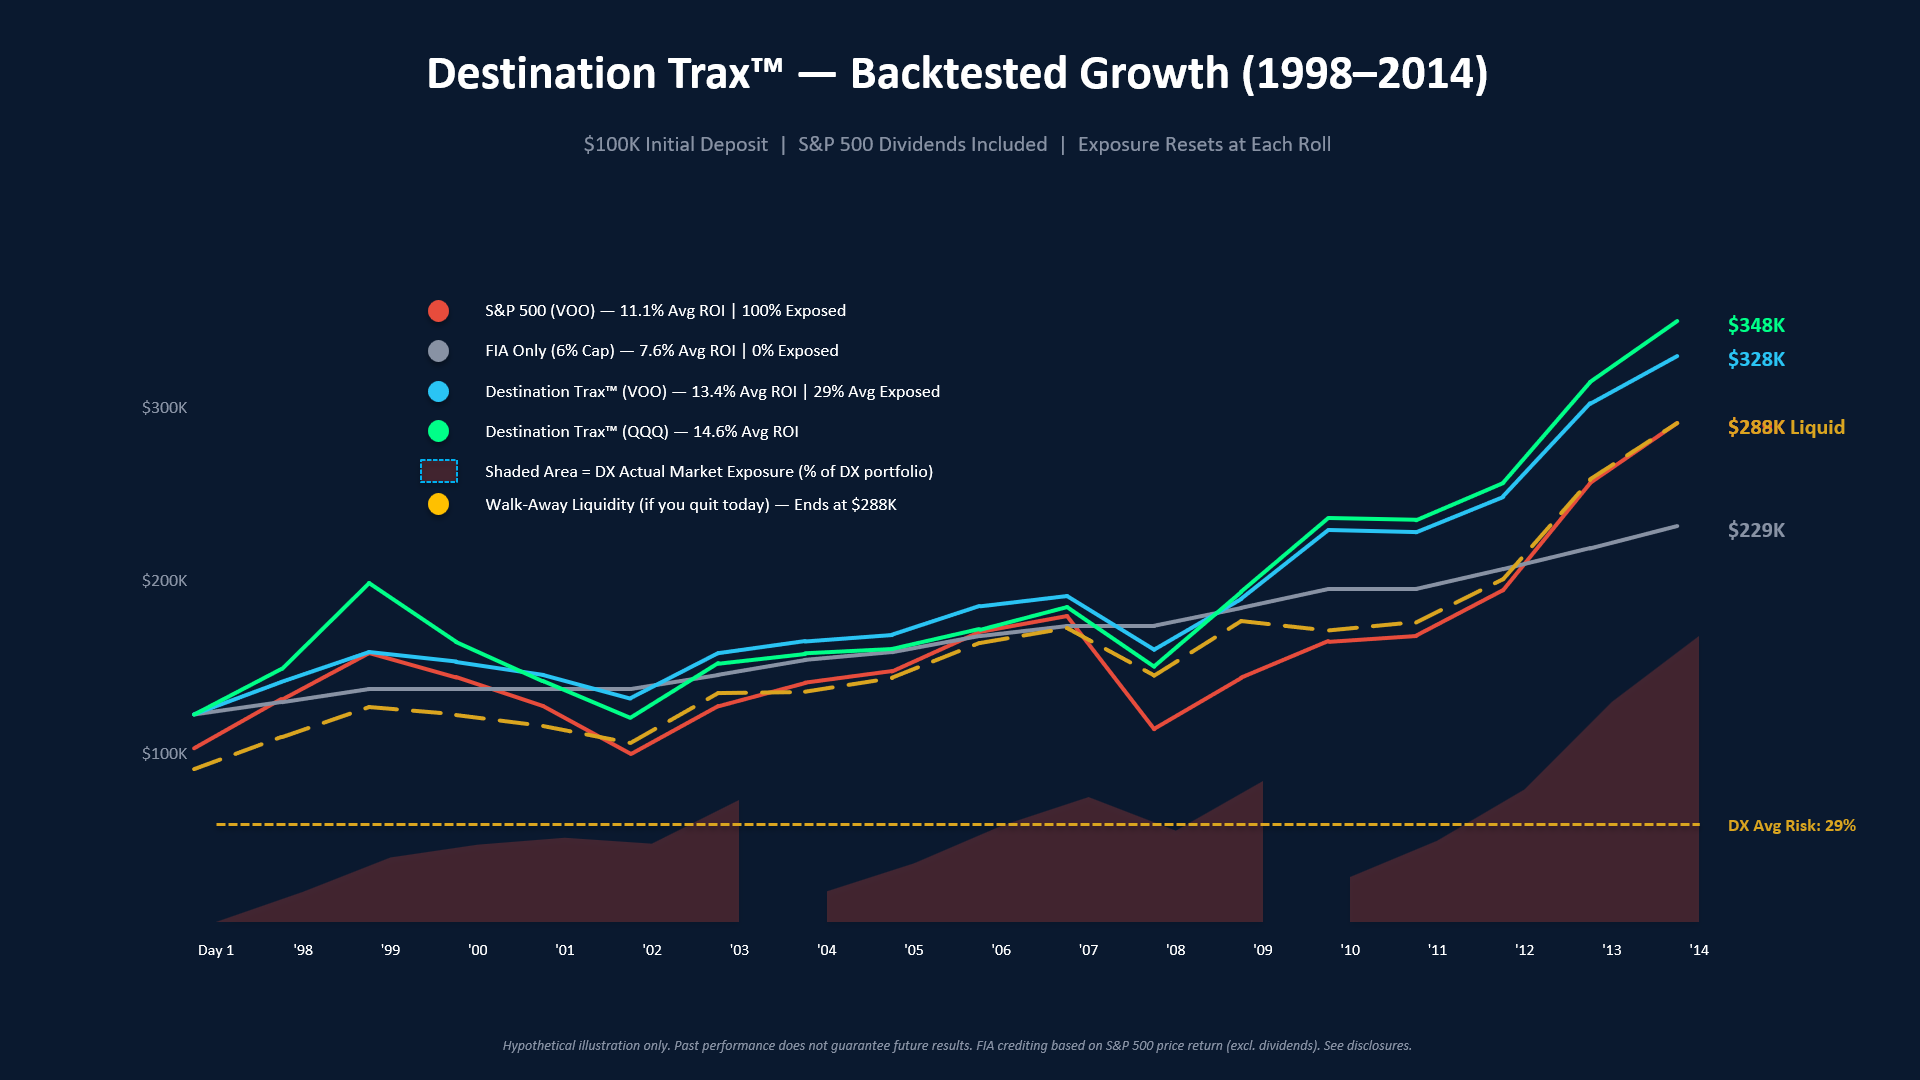
The Full-Risk Investor (Red Line)
The S&P 500 — buy, hold, and pray. An 11.1% average return sounds great on paper. But you rode every crash at full exposure: down 9%, 12%, 22% during the dot-com era, then down 37% in a single year in 2008. Your entire life savings at risk, every single day, for 17 years.
The “Safe” Investor (Gray Line)
A traditional Fixed Indexed Annuity with a 6% cap. Never lost a dime — the line simply flattens during crashes. But the cap choked your upside. You ended with $229K while the market hit $289K. Safety without growth is just a slower way to fall behind.
Destination Trax™ (Cyan & Green Lines)
Same $100K. Same 17 years. Same crashes. But Destination Trax™ averaged 13.4% to 14.6% annually (hypothetical, net of fees) — beating the S&P 500 by over 20% (based on backtested model) — while keeping an average of only 29% of your money exposed to the market at any given time.
The strategy uses a proprietary sequencing of protection, harvesting, and reinvestment that allows each phase to build on the last. The less you risk, the more you keep. The more you keep, the faster it compounds.
Your Walk-Away Money (Gold Dashed Line)
This is the line that closes the conversation. The gold dashed line shows what you could take home — in cash, no questions asked — if you quit the strategy on any given day.
It ends at $288,000 (estimated; actual surrender values depend on specific contract terms). That is essentially equal to the S&P 500 investor who was 100% exposed for 17 straight years. Your floor matches their ceiling.
You are never trapped. Your liquidity alone keeps pace with the market. And your actual portfolio beats it by 30%.
17-Year Results — $100K Deposit
Average Market Exposure
All figures are hypothetical and based on backtested model results, net of fees. Actual performance will vary.
Destination Trax™ vs. Traditional Approaches
| Feature | Destination Trax™ | CDs / Savings | Stock Market | Traditional Annuity |
|---|---|---|---|---|
| Principal Protection | ✓ Yes | ✓ Yes | ✗ No | ✓ Yes (locked) |
| Market-Level Growth | ✓ Yes | ✗ No | ✓ Yes | ✗ No |
| Access to Money | ✓ 10% + full after surrender | ✓ Yes | ✓ Yes | ✗ Surrendered |
| Crash Protection | ✓ FIA floor | ✓ FDIC | ✗ Full exposure | ✓ Not market-linked |
| Hypothetical Return | ~13.4% Avg ROI | ~4–5% | ~10% (full risk) | ~3–5% (locked) |
Why Shopping for the Right FIA Matters
Out of 375 eligible crediting methods, the difference between the best and worst performers is over 7 percentage points annually. Over 10 years, that compounds into hundreds of thousands of dollars.
| # | Carrier / Product | AM Best | Index / Crediting Method | Bonus | 10-Yr Return |
|---|---|---|---|---|---|
| 1 | [REDACTED] | A+ | S&P 500 / Monthly / Sum | 14% | 12.81% |
| 2 | [REDACTED] | A- | S&P 500 / Monthly / Sum | 0% | 11.07% |
| 3 | [REDACTED] | A+ | AI Powered Global Opportunities* / Annual / P-P | 13% | 10.94% |
| 4 | [REDACTED] | A- | S&P 500 / Monthly / Sum | 0% | 10.81% |
| 5 | [REDACTED] | A- | AI Powered Global Opportunities* / Annual / P-P | 0% | 9.09% |
| 6 | EquiTrust / Market Value Index | B+ | S&P 500 Dynamic Intraday TCA* / Annual / P-P | 0% | 7.46% |
| 7 | Athene / Performance Elite 10 | A+ | UBS Innovative Balanced* / Annual / P-P | 13% | 7.44% |
| 8 | North American / NAC Control X. | A+ | Barclays Transitions 12% VC* / Annual / P-P | 0% | 7.42% |
| 9 | Nassau / Growth Annuity w/Inc G-B | B++ | S&P 500 / Annual / P-P | 0% | 7.10% |
| 10 | Nassau / Growth Annuity G-B | B++ | S&P 500 / Annual / P-P | 0% | 7.10% |
| ... 40 more crediting methods ranked below ... | down to 5.35% | ||||
Source: IndexAlyzer. Hypothetical back-tested returns. Past performance is not indicative of future results. Carrier names redacted for products above 9% avg annual return. See full disclosure for details.
Why Destination Trax™ Is Different
You Keep Control
Your money is never surrendered. Walk away with your full value at any time.
Growth Without the Gamble
Market-level growth through disciplined signals while principal stays protected.
Battle-Tested 20 Years
Applied with real clients through 2008, 2020, and 2022 crashes.
Two Engines Working Together
FIA earns steady returns. Market account captures growth. Both working simultaneously.
A.I.-Powered FIA Selection
Curated shortlist of top-performing FIAs based on rigorous back-tested criteria.
Built by a Retired Fiduciary
Created by Ken Gulliver — top 1% RIA who built what he wished existed for his clients.
Who Is Destination Trax™ For?
5–15 Years to Retirement
Cannot afford a crash, but need growth to close the gap.
Already Retired
Need growth to outpace inflation without risking principal.
Business Exit / Windfall
Large lump sum that needs to grow safely while you plan.
IRA / 401(k) Rollovers
Ideal vehicle for qualified money that needs protection + growth.
The Mind Behind Destination Trax™
Ken Gulliver is a retired Registered Investment Advisor ranked in the top 1%, a former top-quintile Merrill Lynch advisor, 3x published author, public speaker, and Marine Corps veteran.
Top 1% RIA • Merrill Lynch Top Quintile • 3x Published Author • Marine Corps Veteran • MyFidu™ Creator
Common Questions About Destination Trax™
What is a Fixed Indexed Annuity (FIA)?
Is my principal really protected?
What is the 10% penalty-free withdrawal?
How is this different from a traditional annuity?
What happens after the cycle ends?
Do I need a financial advisor to use this?
Is this too good to be true?
Disclosure & Methodology
This page contains hypothetical backtested illustrations. They were not produced in real-time and do not represent the actual performance of any client account. Results are based on historical S&P 500 data (1998–2014) applied to a model using specific Fixed Indexed Annuity parameters including a 20% premium bonus, 6% annual cap, 0% floor, and 10% annual penalty-free withdrawal. These product parameters are based on products available today, which may not be available in the future. All returns shown are net of product fees and charges.
Growth account returns assume reinvestment in VOO (S&P 500 ETF) or QQQ (Nasdaq-100 ETF) at actual historical total returns including dividends. Walk-away values reflect estimated surrender charges and bonus clawback schedules typical of the modeled product class. Actual FIA products vary in caps, participation rates, bonus structures, and surrender schedules.
Destination Trax™ is designed for use within qualified retirement accounts (Traditional IRA, Roth IRA). Tax treatment varies by account type and individual circumstances. This is not investment advice and does not constitute a recommendation to purchase any specific product. Consult a licensed financial professional before making decisions.
Read Full Methodology & Assumptions →